nested for loop and permutation design
by royyang
Nested For Loop and Permutation Design
Description
This workshop introduced the nested for loop in an accessible way for people new to coding. A self-made tool by p5.js was used to better visualize the Nested For Loop from surface results to uncovered principles and execute processes behind it. Then, we explored the concept of Permutation Design and created our design table of logo variants.
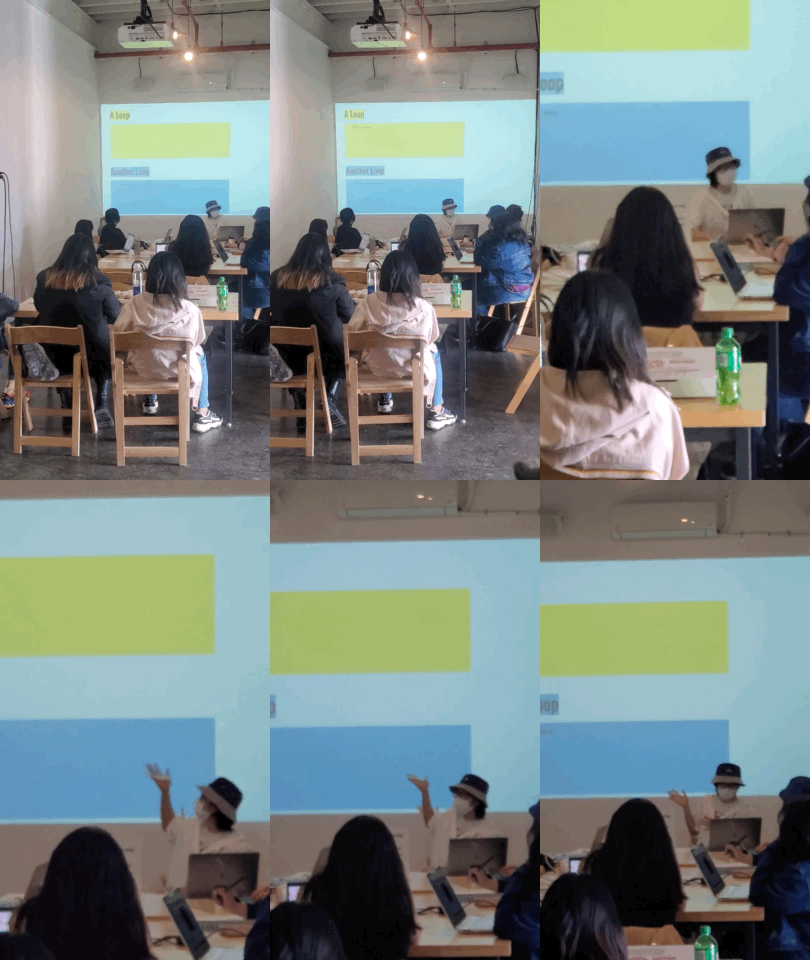
Roy was introducing two separate loops.
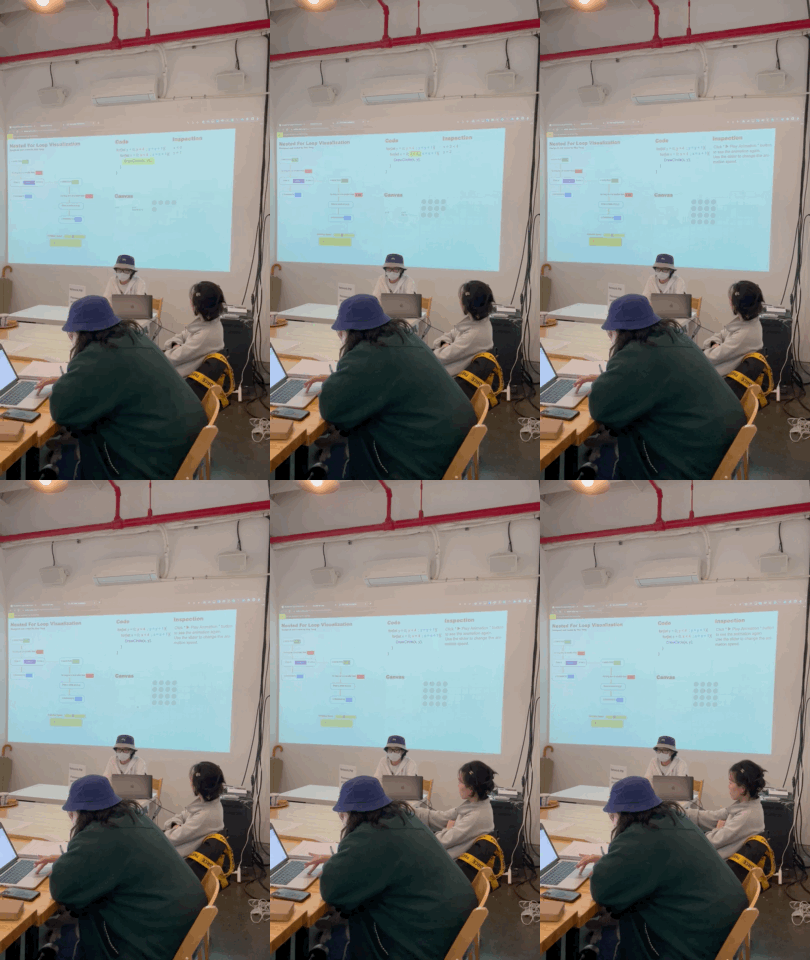
Roy was showing how to play with the self-made Nested For Loop visualizer.
Workshop Details
What is a Nested Loop?
From the definition, a nested loop is a loop inside the body of the outer loop. As shown below. the cyan loop block is put inside the yellow loop block. Hence, the yellow loop becomes an outer loop while the cyan loop is an inner loop as well as a nested loop.

A yellow rectangle represents a loop. A cyan rectangle represents another loop. The cyan rectangle is then put inside the yellow rectangle to form a nested loop.
For one loop, if we want to “Do Something” in one loop, the result is to “Do Something” repeatedly until the end of the loop.
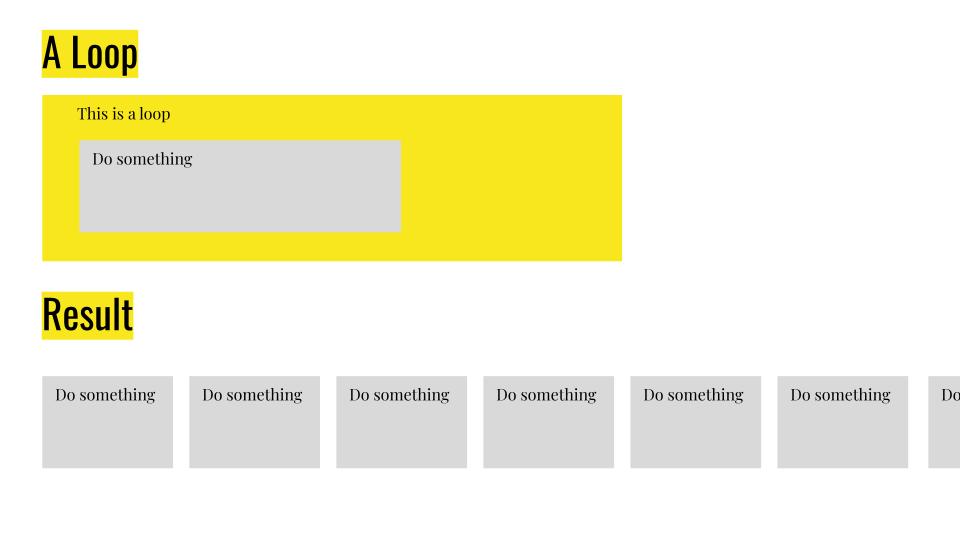
The gray rectangles of “Do something” are shown repeatedly as the result of the “Do something” gray rectangles in a yellow rectangle of loop.
For two loops with one inner loop of “Do Something” nested in the outer loop, the result should be to execute the inner loop repeatedly until the end of the outer loop. And for each inner loop, the sub-result is to “Do Something” repeatedly until the end of that inner loop. Therefore, the total result is to “Do Something” repeatedly until the end of the inner loop, then repeat the same process until the end of the outer loop.
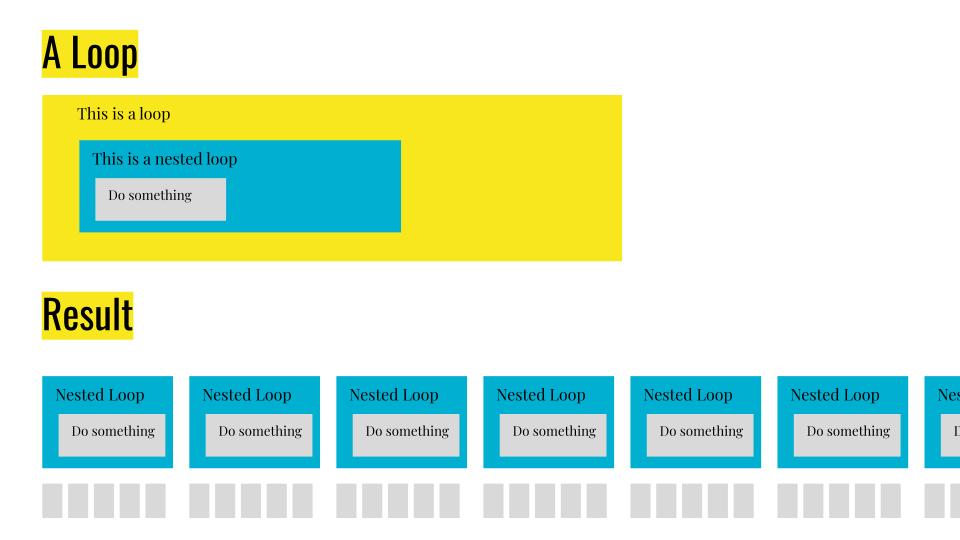
The gray rectangles of “Do something” are shown repeatedly as the result of the “Do something” gray rectangles in a cyan rectangle of inner loop which is looped in a yellow rectangle of outer loop.
What is a Nested For Loop?
The basic syntax in p5.js for a single For Loop is like this. It means x starts from 0, as long as x is smaller than 10, DoSomething, then x plus 1.
for(let x = 0; x < 10; x = x + 1) {
    DoSomething();
}
While for the Nested For Loop, the syntax is similar, by replacing DoSomething with another loop with DoSomething like this.
for(let x = 0; x < 10; x = x + 1) {
    for(let y = 0; y < 10; y = y + 1) {
        DoSomething();
    }
}
Note that,
- Normally, the variable's name in a loop is the same, unless you know exactly what the start point, the end condition, and the actions are.
- The name of the variable (eg. y) in the inner loop must be different from the outer loop (eg. x).
- Semicolon! Semicolon! Semicolon! The divide symbol in the brackets is semicolons instead of commas.
Play with the Nested For Loop visualizer
The link for the Nested For Loop visualizer I made by p5.js is: https://editor.p5js.org/Mustard-Roy/full/QHkGnGqtx
If the page doesn’t fit your screen, try to zoom out by pressing Command and Minus sign (-) for Mac / Windows logo key and Minus sign (-) for Windows.
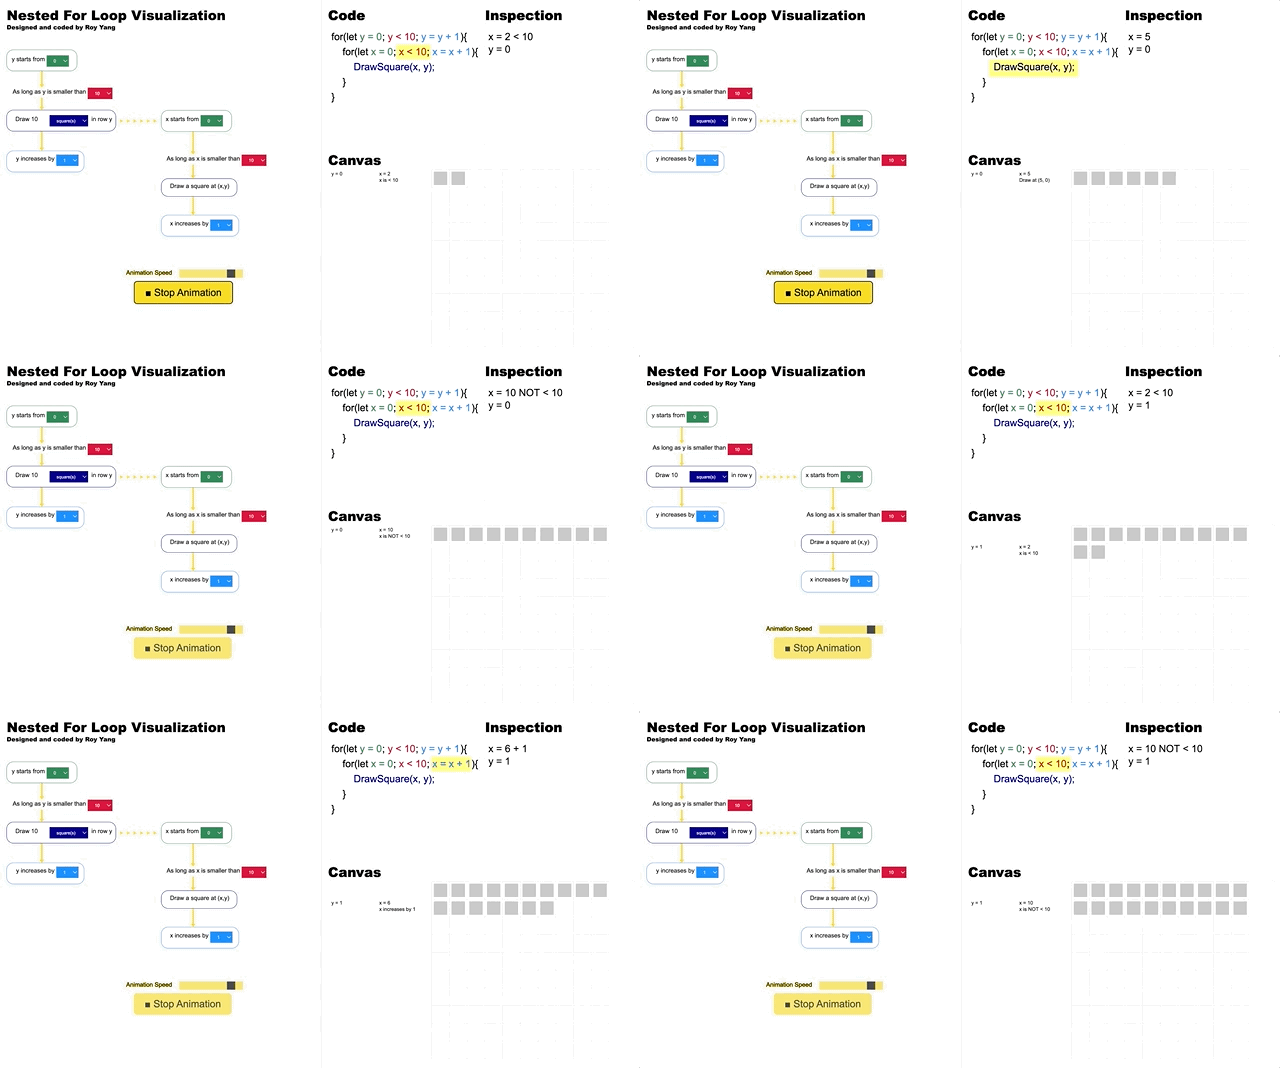
An animated gif for the Nested For Loop Visualizer.
Suggest steps
- Change the options from the drop-down menus on the left and see the corresponding changes of codes and canvas on the right. For instance, we can change “squares” to “circles”, change y is smaller than “10” to “5”, change x increases by “1” to “2”, etc.
- Click the “Play Animation” button to see the drawing process on canvas.
- Adjust the Animation Speed to slow, play the animation, and pay attention to the actions written next to the canvas grids, the inspections, as well as the yellow highlight in the code blocks.
- Change to x starts from “10” and x is smaller than “1”, the result in the canvas should be null. Think about the code execution process first, and then play the animation. Noted that the code is quite “stupid” because it has to go through each y value to see if 10 is smaller than 1 every time.
Quiz
What is the results of the following code?
for(let x = 0; x < 2; x = x + 1) {
    GoToSchool();
    for(let y = 0; y < 3; y = y + 1) {
        WaitForTrafficLight();
}
    GoHome();
}
The result should be:
GoToSchool → WaitForTrafficLight → WaitForTrafficLight → WaitForTrafficLight → GoHome → GoToSchool → WaitForTrafficLight → WaitForTrafficLight → WaitForTrafficLight → GoHome
Draw anything in a grid by p5.js
A quick example could be to draw squares in a grid by the live code below:
function setup() {
  createCanvas(400, 400);
  background(220);
  for (let i = 0; i < width; i = i + 40)
    for (let j = 0; j < height; j = j + 40) {
      square(i, j, 10);
    }
}

function draw() {}
Participants are encouraged to draw anything they like in a grid. In the workshop, me and the other TAs helped the participants by answering their questions and fixing errors to make sure no one was behind.
What is Permutation Design
After successfully drawing anything in a grid, we moved to the next section about permutation design.
According to PERMUTATION DESIGN by Kostas Terzidis,
A permutation is an ordered arrangement of elements in a set. In our case, the set is design and the elements are design components, such as lines, shapes, forms, or spaces.
Traditionally, such arrangements are done by human designers who base their decision-making process either on intuition or on random sampling until a valid solution is found. However, in both cases the solution found may be an acceptable one but cannot be labeled as "the best possible solution" due to the subjective or arbitrary nature of the selection process. In contrast, by harnessing the potential of computational design, these elements can be arranged in all possible ways and then the best ones are chosen based on specific criteria. By presenting a complete list of permutation-based arrangements the "best solution" will eventually reveal itself by excluding all other possible solutions.
Example - 1:
384 possible arrangements of a simple four-fixture bathroom
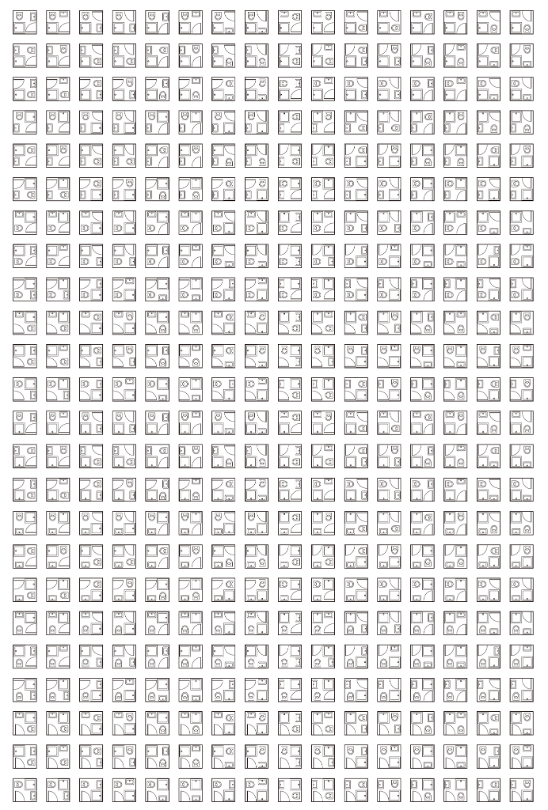
All the arrangements of a four-fixture bathroom listed in a grid.
8 successful designs of eliminating all arrangements that have a toilet seat facing a door and eliminating any arrangement that uses more than 6m of pipelines.
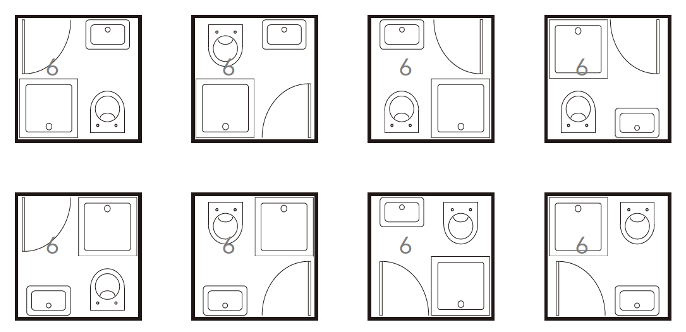
The 8 successful arrangments listed in a grid.
Example - 2:
MIT Media Lab Identity by TheGreenEyl studio, creative directed and designed by Richard The, E Roon Kang, programmed and designed by Willy Sengewald by Processing tool.
Animations and prints of the MIT Media Lab‘s new visual identity which reflects the spirit of transparency and the place of mutual inspiration and collaboration.

Some of the MIT Media Lab logos among the 40,000 variants in total.
Create our own design table of logo variants
Participants could start from their existing codes of drawing a grid, start a totally new one or refer to the templates I provided. Template - 1 includes 2 For Loops drawing a 10 by 10 grid. Template - 2 includes 4 For Loops drawing a 30 by 30 grid with each 10 by 10 as a group.
Template - 1: https://editor.p5js.org/Mustard-Roy/sketches/x9XHJEE7m
Template - 2: https://editor.p5js.org/Mustard-Roy/sketches/H--DsFQVG
General Steps:
- Draw a single logo as the base
- Define the variables in the logo (Size? Position? Color? Shape type? etc.)
- Determine the changing interval for each variable (How do they change?)
- Loop each variable in a For Loop
- Nest the for loops one by one and arrange the drawings in a grid
Examples:
Based on the templates:
Example - 1: https://editor.p5js.org/Mustard-Roy/sketches/ov06c0ReG

The canvas result of Example - 1
Example - 2: https://editor.p5js.org/Mustard-Roy/sketches/DaQu2Ay4h

The canvas result of Example - 2
Live coding:
Workshop live coding example: https://editor.p5js.org/Mustard-Roy/sketches/5_1GRZ_F2
Resources
- Notion Page: https://royya.notion.site/Nested-For-Loop-ff8c336b1f9041d8bfb10988c2e7d095
- Nested For Loop Visualizer: https://editor.p5js.org/Mustard-Roy/full/QHkGnGqtx
- Permutation Design: Buildings, Texts, and Contexts By Kostas Terzidis: https://www.routledge.com/Permutation-Design-Buildings-Texts-and-Contexts/Terzidis/p/book/9780415644501
- MIT Media Lab Identity by TheGreenEyl: https://vimeo.com/20250134?embedded=true&source=video_title&owner=1878861
- Workshop Template 1: https://editor.p5js.org/Mustard-Roy/sketches/x9XHJEE7m
- Workshop Template 2: https://editor.p5js.org/Mustard-Roy/sketches/H--DsFQVG
- Workshop Example 1: https://editor.p5js.org/Mustard-Roy/sketches/ov06c0ReG
- Workshop Example 2: https://editor.p5js.org/Mustard-Roy/sketches/DaQu2Ay4h
- Workshop Slides: https://docs.google.com/presentation/d/1gcySt4Cj7uRxe69srLydJ6tz-Bc-QJCEtgd8UUtUm48/edit?usp=sharing
- Workshop Live Coding Example: https://editor.p5js.org/Mustard-Roy/sketches/x9XHJEE7m